Hello
I’m running an experiment with a custom gym env.
After 15h of training, 720.000 steps trained, which account for 500 episodes give or take, the thing slows down up to the point where 4 episodes were taking 7 minutes and now they take 2h30m
As it runs flawlesly for so long, I’m assuming there is no issue on the environment. I don’t know if a memory leak could be slowly building up up until it colapses the computer, but I don’t think so because (1) the computer is fully responsive as I’m writing this post adn (2) Tune output has been printing the memory usage and it is high but stable, below the 90% warning threshold, moreover, if anything, it is drastically going down as we speak… it’s been at 25GB/32GB for the whole training and just now it has gone down to 14GB
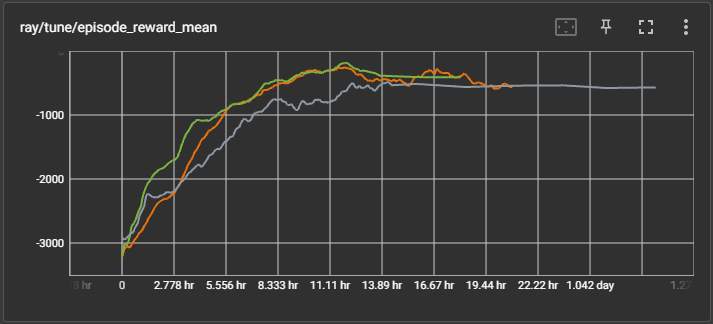
Also, I don’t know if this can be related, but looking at tensorboard I’d say reward mean has plateaud (maybe not, it’s the first time I’m using a stopper so I’m not sure what a standard stopping plateau should look like) but the stopper has not caused the trial to end.
This is my code (if you see anything screaming “BAD PRACTICE!” please please kindly let me know ![]() )
)
ray.init(runtime_env={"working_dir": "generic"}, num_cpus=8, num_gpus=1,log_to_driver=True, logging_level= "critical" )
register_env("custom_env")

ppo_config = (
    PPOConfig()
    .resources(num_gpus=1, num_cpus_per_worker=1)
    .environment(env="custom_env", disable_env_checking=True)
    .rollouts( num_rollout_workers=4, num_envs_per_worker=1, create_env_on_local_worker=False,  batch_mode="complete_episodes")
    .framework(framework="tf2", eager_tracing=True)
    .training(
        model={"use_lstm":True},
        gamma=tune.grid_search([0.97, 0.98, 0.985]),
        lr=tune.grid_search([ 5e-5, 1e-4,5e-6])
        )
)

stopper = CombinedStopper(
    MaximumIterationStopper(max_iter=250),
    TrialPlateauStopper(metric="episode_reward_mean"),
)

analysis = tune.run(
    "PPO",
    config = ppo_config.to_dict(),
    stop = stopper,
    local_dir = "D:/ray_results",
    checkpoint_freq = 10,
    verbose = 2,
    metric = "episode_reward_mean",
    mode = "max"
)
This is one sample of the output ray tune is printing:
== Status ==
Current time: 2023-05-08 22:37:15 (running for 1 days, 03:49:45.87)
Memory usage on this node: 14.5/31.9 GiB
Using FIFO scheduling algorithm.
Resources requested: 5.0/8 CPUs, 1.0/1 GPUs, 0.0/12.28 GiB heap, 0.0/6.14 GiB objects (0.0/1.0 accelerator_type:G)
Current best trial: dafa1_00000 with episode_reward_mean=-578.2958999996466 and parameters={'extra_python_environs_for_driver': {}, 'extra_python_environs_for_worker': {}, 'num_gpus': 1, 'num_cpus_per_worker': 1, 'num_gpus_per_worker': 0, '_fake_gpus': False, 'custom_resources_per_worker': {}, 'placement_strategy': 'PACK', 'eager_tracing': True, 'eager_max_retraces': 20, 'tf_session_args': {'intra_op_parallelism_threads': 2, 'inter_op_parallelism_threads': 2, 'gpu_options': {'allow_growth': True}, 'log_device_placement': False, 'device_count': {'CPU': 1}, 'allow_soft_placement': True}, 'local_tf_session_args': {'intra_op_parallelism_threads': 8, 'inter_op_parallelism_threads': 8}, 'env': 'custom_env', 'env_config': {}, 'observation_space': None, 'action_space': None, 'env_task_fn': None, 'render_env': False, 'clip_rewards': None, 'normalize_actions': True, 'clip_actions': False, 'disable_env_checking': True, 'is_atari': False, 'num_envs_per_worker': 1, 'sample_collector': <class 'ray.rllib.evaluation.collectors.simple_list_collector.SimpleListCollector'>, 'sample_async': False, 'enable_connectors': False, 'rollout_fragment_length': 'auto', 'batch_mode': 'complete_episodes', 'remote_worker_envs': False, 'remote_env_batch_wait_ms': 0, 'validate_workers_after_construction': True, 'ignore_worker_failures': False, 'recreate_failed_workers': False, 'restart_failed_sub_environments': False, 'num_consecutive_worker_failures_tolerance': 100, 'preprocessor_pref': 'deepmind', 'observation_filter': 'NoFilter', 'synchronize_filters': True, 'compress_observations': False, 'enable_tf1_exec_eagerly': False, 'sampler_perf_stats_ema_coef': None, 'gamma': 0.97, 'lr': 5e-05, 'train_batch_size': 4000, 'model': {'_disable_preprocessor_api': False, '_disable_action_flattening': False, 'fcnet_hiddens': [256, 256], 'fcnet_activation': 'tanh', 'conv_filters': None, 'conv_activation': 'relu', 'post_fcnet_hiddens': [], 'post_fcnet_activation': 'relu', 'free_log_std': False, 'no_final_linear': False, 'vf_share_layers': False, 'use_lstm': True, 'max_seq_len': 20, 'lstm_cell_size': 256, 'lstm_use_prev_action': False, 'lstm_use_prev_reward': False, '_time_major': False, 'use_attention': False, 'attention_num_transformer_units': 1, 'attention_dim': 64, 'attention_num_heads': 1, 'attention_head_dim': 32, 'attention_memory_inference': 50, 'attention_memory_training': 50, 'attention_position_wise_mlp_dim': 32, 'attention_init_gru_gate_bias': 2.0, 'attention_use_n_prev_actions': 0, 'attention_use_n_prev_rewards': 0, 'framestack': True, 'dim': 84, 'grayscale': False, 'zero_mean': True, 'custom_model': None, 'custom_model_config': {}, 'custom_action_dist': None, 'custom_preprocessor': None, 'lstm_use_prev_action_reward': -1, '_use_default_native_models': -1}, 'optimizer': {}, 'max_requests_in_flight_per_sampler_worker': 2, 'explore': True, 'exploration_config': {'type': 'StochasticSampling'}, 'policies': {'default_policy': (None, None, None, None)}, 'policy_states_are_swappable': <ray.rllib.algorithms.algorithm_config._NotProvided object at 0x0000019AB497F400>, 'input_config': {}, 'actions_in_input_normalized': False, 'postprocess_inputs': False, 'shuffle_buffer_size': 0, 'output': None, 'output_config': {}, 'output_compress_columns': ['obs', 'new_obs'], 'output_max_file_size': 67108864, 'offline_sampling': False, 'evaluation_interval': None, 'evaluation_duration': 10, 'evaluation_duration_unit': 'episodes', 'evaluation_sample_timeout_s': 180.0, 'evaluation_parallel_to_training': False, 'evaluation_config': None, 'off_policy_estimation_methods': {}, 'ope_split_batch_by_episode': True, 'evaluation_num_workers': 0, 'always_attach_evaluation_results': False, 'enable_async_evaluation': False, 'in_evaluation': False, 'sync_filters_on_rollout_workers_timeout_s': 60.0, 'keep_per_episode_custom_metrics': False, 'metrics_episode_collection_timeout_s': 60.0, 'metrics_num_episodes_for_smoothing': 100, 'min_time_s_per_iteration': None, 'min_train_timesteps_per_iteration': 0, 'min_sample_timesteps_per_iteration': 0, 'export_native_model_files': False, 'checkpoint_trainable_policies_only': False, 'logger_creator': None, 'logger_config': None, 'log_level': -1, 'log_sys_usage': True, 'fake_sampler': False, 'seed': None, 'worker_cls': None, 'rl_module_class': None, '_enable_rl_module_api': False, '_tf_policy_handles_more_than_one_loss': False, '_disable_preprocessor_api': False, '_disable_action_flattening': False, '_disable_execution_plan_api': True, 'simple_optimizer': True, 'replay_sequence_length': None, 'horizon': -1, 'soft_horizon': -1, 'no_done_at_end': -1, 'lr_schedule': None, 'use_critic': True, 'use_gae': True, 'kl_coeff': 0.2, 'sgd_minibatch_size': 128, 'num_sgd_iter': 30, 'shuffle_sequences': True, 'vf_loss_coeff': 1.0, 'entropy_coeff': 0.0, 'entropy_coeff_schedule': None, 'clip_param': 0.3, 'vf_clip_param': 10.0, 'grad_clip': None, 'kl_target': 0.01, 'vf_share_layers': -1, '__stdout_file__': None, '__stderr_file__': None, 'lambda': 1.0, 'input': 'sampler', 'multiagent': {'policies': {'default_policy': (None, None, None, None)}, 'policy_mapping_fn': <function AlgorithmConfig.__init__.<locals>.<lambda> at 0x0000019ABC19BD90>, 'policies_to_train': None, 'policy_map_capacity': 100, 'policy_map_cache': -1, 'count_steps_by': 'env_steps', 'observation_fn': None}, 'callbacks': <class '__main__.customCB'>, 'create_env_on_driver': False, 'custom_eval_function': None, 'framework': 'tf2', 'num_cpus_for_driver': 1, 'num_workers': 4}
Result logdir: D:\ray_results
Number of trials: 9/9 (8 PENDING, 1 RUNNING)
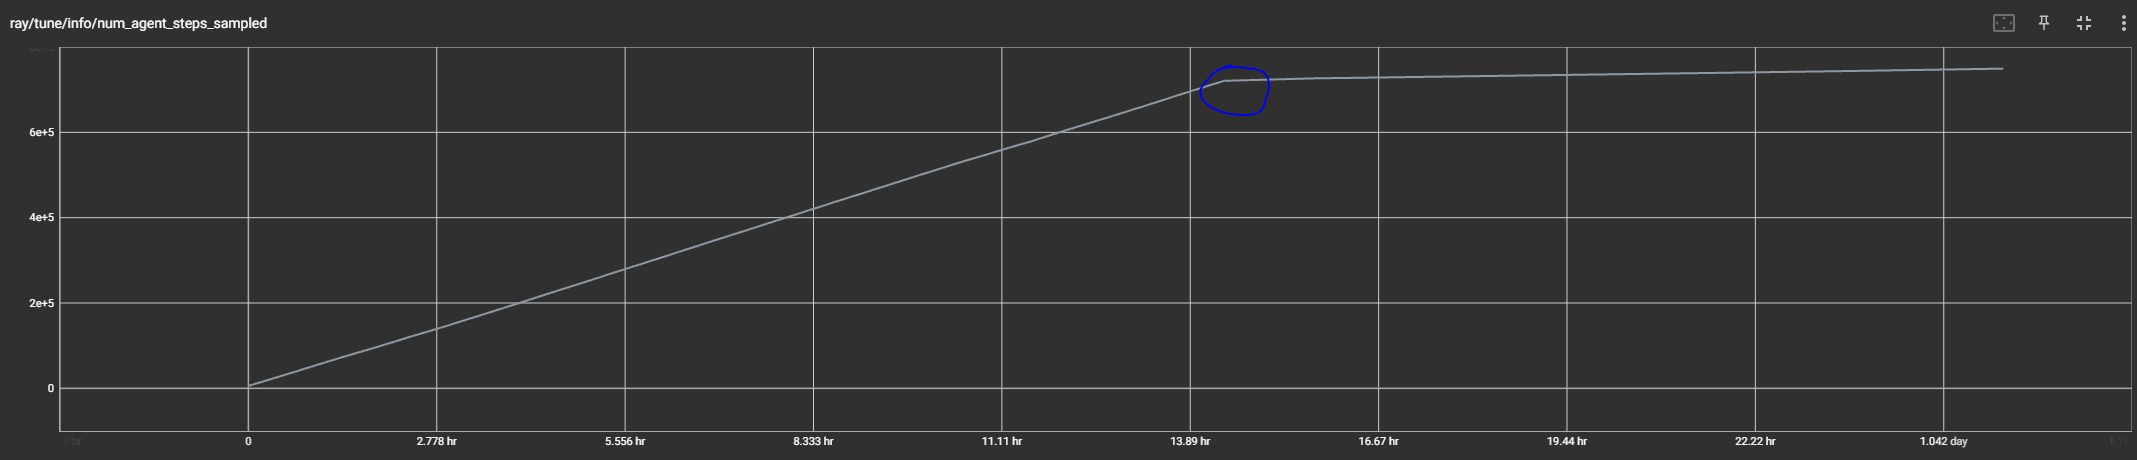
This is the chart from tensorboard showing the slow progress it’s stuck at right now:
And finally, the tensorboard chart showing how the thing may have plateaud (or maybe no) but it’s still running, moreover, the slow down happens shortly after the plateau seems to start, I don’t know if it’s a coincidence or something on my stopper setup is wrong and causing this whole issue:

any pointer to what could be the issue is very much appreciated
thanks