How severe does this issue affect your experience of using Ray?
- High: It blocks me to complete my task.
I’m currently seeing high memory usage on our cluster at times when the cluster is inactive. This feels like a leak but I’m not sure where to begin to investigate.
(base) ➜  ghost git:(master) kubectl top pods
NAME                                 CPU(cores)   MEMORY(bytes)
ray-cluster-head-glhcj               233m         8814Mi
ray-cluster-worker-group-cpu-2dfxw   78m          16759Mi
ray-cluster-worker-group-cpu-2trpl   98m          29028Mi
ray-cluster-worker-group-cpu-btnh9   93m          19810Mi
ray-cluster-worker-group-cpu-hw26f   78m          14724Mi
ray-cluster-worker-group-cpu-jn52z   103m         16448Mi
ray-cluster-worker-group-cpu-p59cx   78m          22880Mi
ray-cluster-worker-group-cpu-tmkzw   98m          30623Mi
ray-cluster-worker-group-cpu-v5k2t   78m          17013Mi
ray-cluster-worker-group-cpu-zpmjx   89m          22920Mi
ray-cluster-worker-group-cpu-zpw4m   109m         21765Mi
ray-cluster-worker-group-gpu-6kbvd   99m          14251Mi
ray-cluster-worker-group-gpu-7qnhq   130m         26942Mi
ray-cluster-worker-group-gpu-brlql   98m          19955Mi
ray-cluster-worker-group-gpu-j7vs4   78m          17171Mi
ray-cluster-worker-group-gpu-m2mjd   61m          575Mi
ray-cluster-worker-group-gpu-pjb6r   114m         30894Mi
ray-cluster-worker-group-gpu-prh5d   67m          618Mi
ray-cluster-worker-group-gpu-r9rpd   103m         16480Mi
ray-cluster-worker-group-gpu-tjfkk   82m          16220Mi
ray-cluster-worker-group-gpu-xxfwl   83m          16104Mi
If I jump into one of the nodes, I see the following :
(base) root@ray-cluster-worker-group-cpu-zpmjx:/opt/ray# ray memory
======== Object references status: 2023-05-30 10:58:59.884291 ========
Grouping by node address...        Sorting by object size...        Display allentries per group...


--- Summary for node address: 172.27.156.193 ---
Mem Used by Objects  Local References  Pinned        Used by task   Captured in Objects  Actor Handles
0.0 B                0, (0.0 B)        0, (0.0 B)    0, (0.0 B)     0, (0.0 B)           1, (0.0 B)

--- Object references for node address: 172.27.156.193 ---
IP Address    | PID      | Type    | Call Site | Status    | Size     | Reference Type | Object Ref

172.27.156.193 | 62305    | Worker  | disabled  | -         | ?        | ACTOR_HANDLE   | ffffffffffffffffed3ba63749898995a8fd4f2ee405000001000000

To record callsite information for each ObjectRef created, set env variable RAY_record_ref_creation_sites=1

--- Aggregate object store stats across all nodes ---
Plasma memory usage 0 MiB, 0 objects, 0.0% full, 0.0% needed
Objects consumed by Ray tasks: 1232 MiB.
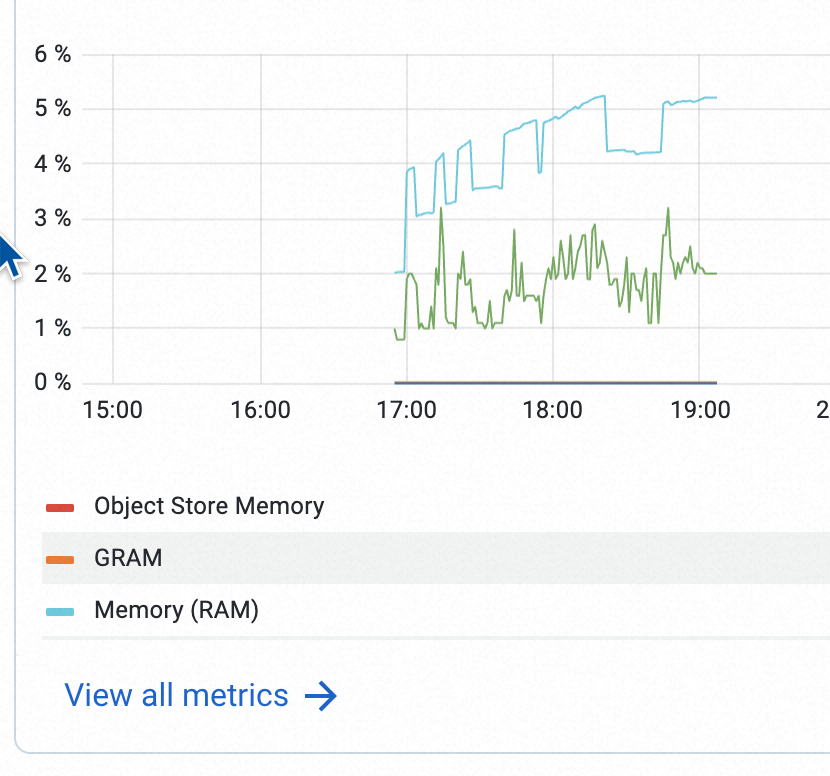
Attaching a screenshot of that nodes heap memory :