How severe does this issue affect your experience of using Ray?
- High: It blocks me to complete my task.
When I run the following code for selfplay training, everything works and the experiment runs to completion.
For the next step in my science, I implemented a wrapper that changes the game dynamics by adding in dominant strategies:
The new code is just this:
class DSOpenSpielEnv(OpenSpielEnv):
    def __init__(self, spiel_env, env_config):
        super().__init__(spiel_env)
        self._skip_env_checking = True
        self.env_config = env_config
        self.dominant_strategy = env_config.get('dominant_strategy', [1, 2])
        self.dominant_active_for_agent = 0
        self.action_memory = []

        # should already exist because of super class, but just in case
        self.observation_space = gymnasium.spaces.Box(
            float("-inf"), float("inf"), (self.env.observation_tensor_size(),)
        )
        self.action_space = gymnasium.spaces.Discrete(self.env.num_distinct_actions())

    def set_dominant_active_for_agent(self, agent_id):
        self.dominant_active_for_agent = agent_id

    def reset(self, *, seed=None, options=None):
        obs, _ = super().reset(seed=seed, options=options)
        self.dominant_strategy_index = 0
        self.action_memory = []
        return obs, _

    def step(self, action):
        # call super step
        check_dom = False
        curr_player = self.state.current_player()
        if curr_player == self.dominant_active_for_agent:
            self.action_memory.append(action[curr_player])
            if len(self.action_memory) > len(self.dominant_strategy):
                _ = self.action_memory.pop(0)
            check_dom = True

        obs, rewards, term, truc, info = super().step(action)

        # check to see if the dominant strategy has been triggered by the 'main' agent
        if check_dom:
            if len(self.action_memory) == len(self.dominant_strategy) and all([self.action_memory[i] == self.dominant_strategy[i]
                                                                               for i in range(len(self.action_memory))]):
                rewards = {ag: r for ag, r in enumerate(self.state.returns())}
                if self.dominant_active_for_agent == 0:
                    rewards[0] = 1
                    rewards[1] = -1
                else:
                    rewards[0] = -1
                    rewards[1] = 1
                term = {a: True for a in [0, 1, "__all__"]}
                truc = {a: True for a in [0, 1, "__all__"]}
                obs = {}

        return obs, rewards, term, truc, info
class SetDSCallback(DefaultCallbacks):
    def __init__(self):
        super().__init__()

    def on_episode_start(self, *, worker, base_env, policies, episode, env_index, **kwargs):

        envs = self._get_envs(base_env)

        # need to run the policy mapping fn callback to set the dominant agent
        policy_id = episode.policy_mapping_fn(0, episode, episode.worker)
        if policy_id == "main":
            dominant_agent = 0
        else:
            dominant_agent = 1

        envs[env_index].set_dominant_active_for_agent(dominant_agent)

    def _get_envs(self, base_env):
        if isinstance(base_env, VectorEnvWrapper):
            return base_env.vector_env.get_sub_environments()
        else:
            return base_env.envs
And now there seems to be a memory leak.
So, either it’s my wrapper/callback or the MultiCallback is somehow leaking and I cannot figure out which.
Any thoughts on what’s happening or about how to test where this might be coming from would be greatly appreciated.
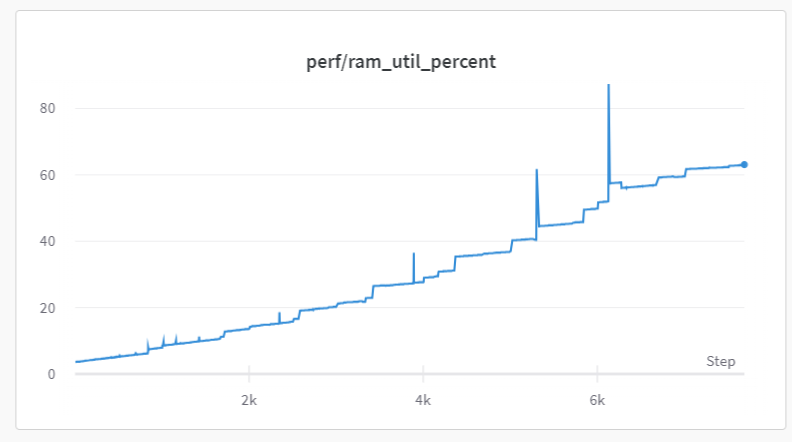
Here’s a graph of the RAM over a failed training run with the additional code that crashed due to running out of RAM:

Here’s a graph of the RAM without the additional code: