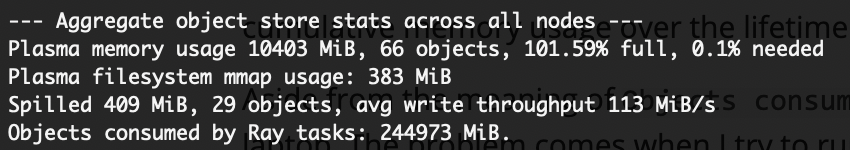
What do each of the statistics in the output of ray memory actually mean (see image)?

In particular, what does the percent “needed” mean, and what is the difference between “Plasma memory usage” and “Objects consumed by ray tasks”?
Yes, I am running into out-of-memory/object spilling issues.
My program basically boils down to:
def do_calculation(dict_of_arrays, list_of_kwargs):
    ref = ray.put(deepcopy(dict_of_arrays))  # a few numpy arrays totaling about 400 MB
    result_refs = [calculcate_func.remote(ref,  **kw) for kw in list_of_kwargs]
    results = ray.get(results_refs)
    return results

for _ in range(20):
    results = do_calculation(my_dict_of_arrays, my_list_of_kwargs)
    # process results
When running on my laptop (MacBook Pro with 2 physical cores), I see what I believe to be the expected behavior. While do_calculation is running, ray memory shows
192.168.0.78  9915   Worker  (deserialize task arg)  406.16442 MB  PINNED_IN_MEMORY    ffffffffffffffffffffffffffffffffffffffff0100000025000000

192.168.0.78  9914   Worker  (deserialize task arg)  406.16442 MB  PINNED_IN_MEMORY    ffffffffffffffffffffffffffffffffffffffff0100000025000000

192.168.0.78  9835   Driver  (put object)  | /Users  406.164426 MB  USED_BY_PENDING_TASK  ffffffffffffffffffffffffffffffffffffffff0100000025000000

--- Aggregate object store stats across all nodes ---
Plasma memory usage 397 MiB, 12 objects, 16.95% full
Objects consumed by Ray tasks: 10079 MiB.
(all other objects listed by ray memory are < 1 MB). Once do_calculation returns, the Plasma memory usage goes to 0 objects and 0.0% until the next iteration starts. However, Objects consumed by Ray tasks just keeps increasing (which is why I want to know what this means - is it cumulative memory usage over the lifetime of a ray cluster?).
Aside from the meaning of Objects consumed by Ray tasks, this works as expected on my laptop. The problem comes when I try to run the exact same program on my university’s computing cluster (managed with Slurm). In that case, ray memory again lists the 400 MB object as Driver (put object) | /Users 406.164426 MB USED_BY_PENDING_TASK plus one listing of Worker (deserialize task arg) 406.16442 MB PINNED_IN_MEMORY for each worker process. But now these objects are not evicted from the Plasma store at the end of each iteration, so the number of pinned objects and the Plasma memory usage just keeps increasing. Eventually the objects are spilled to disk (if I limit the object store memory) or they use up all available memory causing the processes to be kill by slurm. This happens whether I am running on a single node in the cluster or several nodes.
Any ideas what could be causing this?
When running on the cluster, the “percent needed” value from ray memory matches what I expect to be in the object store. During a call to ray.get(result_refs), the needed percent corresponds to the 400 MB divided by object store size, and once ray.get(result_refs) returns and all local references go out of scope, the percent needed goes to 0.0%. But the actual number of pinned objects does not go to zero so the object store fills up. Then once objects start spilling to disk, “percent needed” remains pinned very close to zero.
Here are some ray memory outputs (with object-store-memory=$((10 * 1024 ** 3))):
Before object store fills up:
Immediately after spilling starts:
So things don’t seem to be getting evicted properly even though it works on my laptop.
My task looks like this (where arrays is passed in as an object ref to the shared dict of arrays):
@ray.remote
def solve_single_ray(
    *,
    directory,
    index,
    arrays,
    **kwargs,
):
    """Solve a single setup (ray)."""
    kwargs["device"].set_arrays(arrays)

    log_level = kwargs.pop("log_level", None)
    if log_level is not None:
        logging.basicConfig(level=log_level)

    solutions = solve(**kwargs)

    if directory is None:
        path = None
    else:
        path = os.path.abspath(os.path.join(directory, str(index)))
        save_solutions(solutions, path, save_mesh=False)

    return path
And the call to ray.get() looks like this:
def solve_many_ray(...):
    ...
    arrays_ref = ray.put(arrays)
    ...
    result_ids = []
    for i, kwargs in enumerate(models):
        result_ids.append(
            solve_single_ray.remote(index=i, arrays=arrays_ref, **kwargs)
        )

    # paths is just a list of strings
    paths = ray.get(result_ids)
    return paths

# Everything having to do with `arrays` should now be out of scope, so it should be evicted
# (and it is evicted on my laptop, but not on the cluster)
This was added for internal debugging purpose. You can simply ignore it. We should’ve added a better document around it. Just to help you understand what this means, it is the cumulative size of task arguments in which ray.get is called. For example,
obj = ray.put(object_30MB)
@ray.remote
def f(obj):
    pass
ray.get(f.remote(obj)) # After this, the `consumed by Ray tasks` is 30MB.
# Whenever f is called, it increases by 30MB
It is possible it takes more time in the cluster to evict objects (since it is multi node setup, there’s the RPC overhead to communicate states or eviction requests), and your next iteration starts before that. If you add some long sleep between each iteration (I am not saying as a solution, but I’d like to see if my theory is correct), let’s say like 1 minutes, is it still the same?
Thanks for the suggestions @sangcho
Makes sense.
I just queued up a job where I added time.sleep(60) after each call to solve_many_ray(). I will let you know what happens.
In the meantime, can you just clarify the output of ray memory?
needed the set of all objects in Plasma memory that have active references to them?Plasma memory usage just everything in needed plus objects that don’t have active references but haven’t yet been evicted?Thanks!
Let me explain a bit about how memory is managed. You can also look at https://docs.google.com/document/d/1lAy0Owi-vPz2jEqBSaHNQcy2IBSDEHyXNOQZlGuj93c/preview#
So, plasma store contains the “primary copies” and “secondary copies”. Primary copies are objects that are created for the first time in the cluster. Secondary copies are objects that are copied (for example if you need an object in a remote node, ray needs to copy them).
Secondary copies are actively evicted if there’s memory pressure. Primary copies are evicted only when references are gone out of scope, but if you have memory pressure, they are spilled to the disk at each node. In this case, when you call ray.get, it will restore the object from disk → memory before you get the object. We have some policies around spilling, but you can think it happens when there’s memory pressure.
Note that plasma memory usage is primary copies + secondary copies.
needed means primary copy / available memory. It means you need that much of more memory to have all primary copies in the plasma store.
Lastly, we have a mechanism called fallback allocation. This is triggered when spilling + eviction cannot make any more space. We basically allocate objects directly on disks (but in reality, it is memory + swap memory). This happens rarely, and it is displayed as plasma filesystem mmap usage
- Is
neededthe set of all objects in Plasma memory that have active references to them?
I think needed means you have that percentage more memory is needed to be in progress. In this case Ray can start spilling objects, or doing “fallback allocation”, which allocates memory to the swap memory (that’s Plasma filesystem mmap usage).
Plasma memory usage just everything in needed plus objects that don’t have active references but haven’t yet been evicted?Plasma memory usage is literally the memory usage of plasma store on all nodes. Needed means you need that additional memory to be in progress (and that will be created by spilling mechanism).
Note that objects that are not primary copies are actively evicted, and primary copies are started to be spilled to the disk when you have memory pressure. We also have a mechanism called fallback allocation, which is recently added to make sure the progress is guaranteed under any circumstance as long as you have a disk space.
Thanks for the explanation and design document - that’s very helpful. I’ll read the google doc in more detail later today.
Unfortunately adding a 1 minute sleep after each call to solve_many_ray() did not change the behavior of the program.
This is a somewhat complicated program (solve_many_ray() inside a loop inside a call to scipy.optimize.minimize()), so I will try to mock up something simpler and see if I can reproduce the problem.
Hmm indeed it’s pretty odd for needed (maybe this should be renamed to referenced) to be 0%, but for there to be a large amount of objects still present in memory.
If you can find a repro and file on GitHub, we can look into this with priority.